A performance retrospective using Rust (part 3)
This article is the third part of a performance retrospective regarding the hprof-slurp project.
It is highly recommended to start with the first part to get a good grasp of the context.
In this edition, we will focus on an arguably minor performance issue that will teach us a bit more about Rust along the way.
A short disclaimer: this article has been written using Rust 1.62.1 and its conclusions might not be valid in the future.
Try trait
As usual, our investigation is prompted by a strange artefact in a flamegraph.
Below - in purple - you can see core::ops::try_trait::Try>::branch represents 8.5% of the work in the parser thread (full flamegraph).
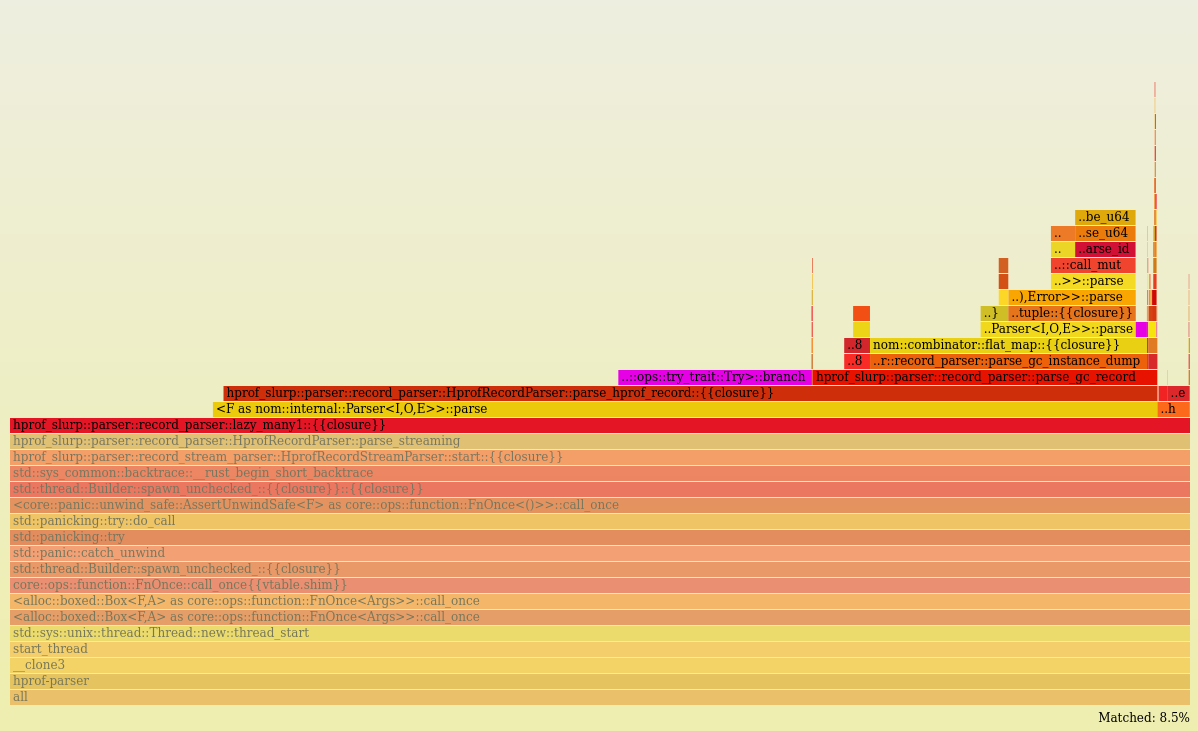
You should know by now that the parser thread is the bottleneck for the whole application. It needs to be as fast as possible.
Therefore, every bit of computation happening on it must be accounted for.
In this case, the slowness seemed to be caused by the Try trait, which does not appear in the code base explicitly.
Our best chance is to simply look at the Rust doc for the branch method.
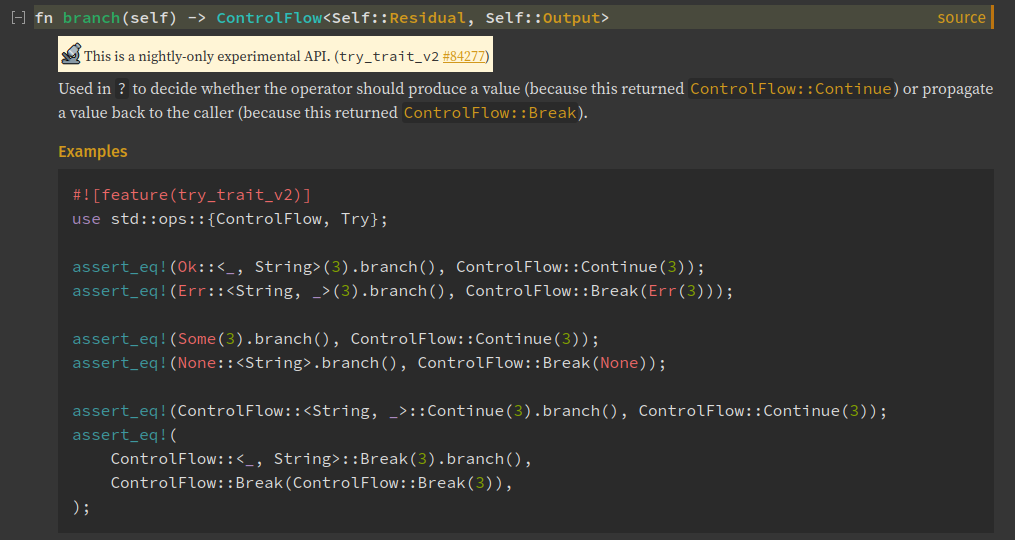
Alright, so this function is a 'nightly-only experimental' API and is called every time the operator ? is used on something that implements the Try trait.
The only possible implementations when using stable Rust are found in the standard library.
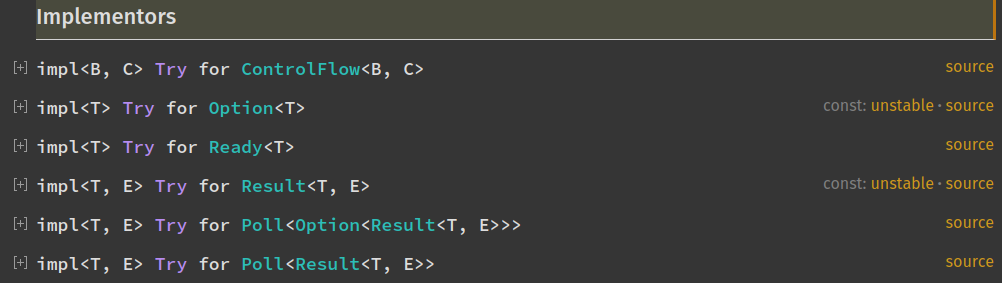
In our case the culprit must be the Result type which is used to track the errors occurring during the parsing phase.
After some digging, I found an existing issue on GitHub appropriately named Reduced performance when using question mark operator instead of try! where several users are reporting similar experiences.
The issue seems to be a bit stale, so we are going to use a workaround this time.
Workaround
If the question mark operator is having an impact on the performance, the most logical step is to not use it.
The previous flamegraph points us to the parse_hprof_record function where we will start by replacing ? with combinators on Result.
The first change uses Result::and_then to chain two results:
     pub fn parse_hprof_record(&mut self) -> impl FnMut(&[u8]) -> IResult<&[u8], Record> + '_ {
         |i| {
             if self.heap_dump_remaining_len == 0 {
-                let (r1, tag) = parse_u8(i)?;
-                if self.debug_mode {
-                    println!("Found record tag:{} remaining bytes:{}", tag, i.len());
-                }
-                match tag {
-                    TAG_STRING => parse_utf8_string(r1),
-                    TAG_LOAD_CLASS => parse_load_class(r1),
-                    TAG_UNLOAD_CLASS => parse_unload_class(r1),
-                    TAG_STACK_FRAME => parse_stack_frame(r1),
-                    TAG_STACK_TRACE => parse_stack_trace(r1),
-                    TAG_ALLOC_SITES => parse_allocation_sites(r1),
-                    TAG_HEAP_SUMMARY => parse_heap_summary(r1),
-                    TAG_START_THREAD => parse_start_thread(r1),
-                    TAG_END_THREAD => parse_end_thread(r1),
-                    TAG_CONTROL_SETTING => parse_control_settings(r1),
-                    TAG_CPU_SAMPLES => parse_cpu_samples(r1),
-                    TAG_HEAP_DUMP_END => parse_heap_dump_end(r1),
-                    TAG_HEAP_DUMP | TAG_HEAP_DUMP_SEGMENT => {
-                        map(parse_header_record, |hr| {
-                            // record expected GC segments length
-                            self.heap_dump_remaining_len = hr.length;
-                            HeapDumpStart { length: hr.length }
-                        })(r1)
+                parse_u8(i).and_then(|(r1, tag)| {
+                    if self.debug_mode {
+                        println!("Found record tag:{} remaining bytes:{}", tag, i.len());
+                    }
+                    match tag {
+                        TAG_STRING => parse_utf8_string(r1),
+                        TAG_LOAD_CLASS => parse_load_class(r1),
+                        TAG_UNLOAD_CLASS => parse_unload_class(r1),
+                        TAG_STACK_FRAME => parse_stack_frame(r1),
+                        TAG_STACK_TRACE => parse_stack_trace(r1),
+                        TAG_ALLOC_SITES => parse_allocation_sites(r1),
+                        TAG_HEAP_SUMMARY => parse_heap_summary(r1),
+                        TAG_START_THREAD => parse_start_thread(r1),
+                        TAG_END_THREAD => parse_end_thread(r1),
+                        TAG_CONTROL_SETTING => parse_control_settings(r1),
+                        TAG_CPU_SAMPLES => parse_cpu_samples(r1),
+                        TAG_HEAP_DUMP_END => parse_heap_dump_end(r1),
+                        TAG_HEAP_DUMP | TAG_HEAP_DUMP_SEGMENT => {
+                            map(parse_header_record, |hr| {
+                                // record expected GC segments length
+                                self.heap_dump_remaining_len = hr.length;
+                                HeapDumpStart { length: hr.length }
+                            })(r1)
+                        }
+                        x => panic!("{}", format!("unhandled record tag {}", x)),
                     }
-                    x => panic!("{}", format!("unhandled record tag {}", x)),
-                }
+                })
And a second change using Result::map:
             } else {
                 // GC record mode
-                let (r1, gc_sub) = parse_gc_record(i)?;
-                let gc_sub_len = i.len() - r1.len();
-                self.heap_dump_remaining_len -= gc_sub_len as u32;
-                Ok((r1, GcSegment(gc_sub)))
+                parse_gc_record(i).map(|(r1, gc_sub)| {
+                    let gc_sub_len = i.len() - r1.len();
+                    self.heap_dump_remaining_len -= gc_sub_len as u32;
+                    (r1, GcSegment(gc_sub))
+                })
             }
         }
     }
After applying those two changes, we can indeed see that core::ops::try_trait::Try>::branch now represents only 0.5% of time in a different call stack.
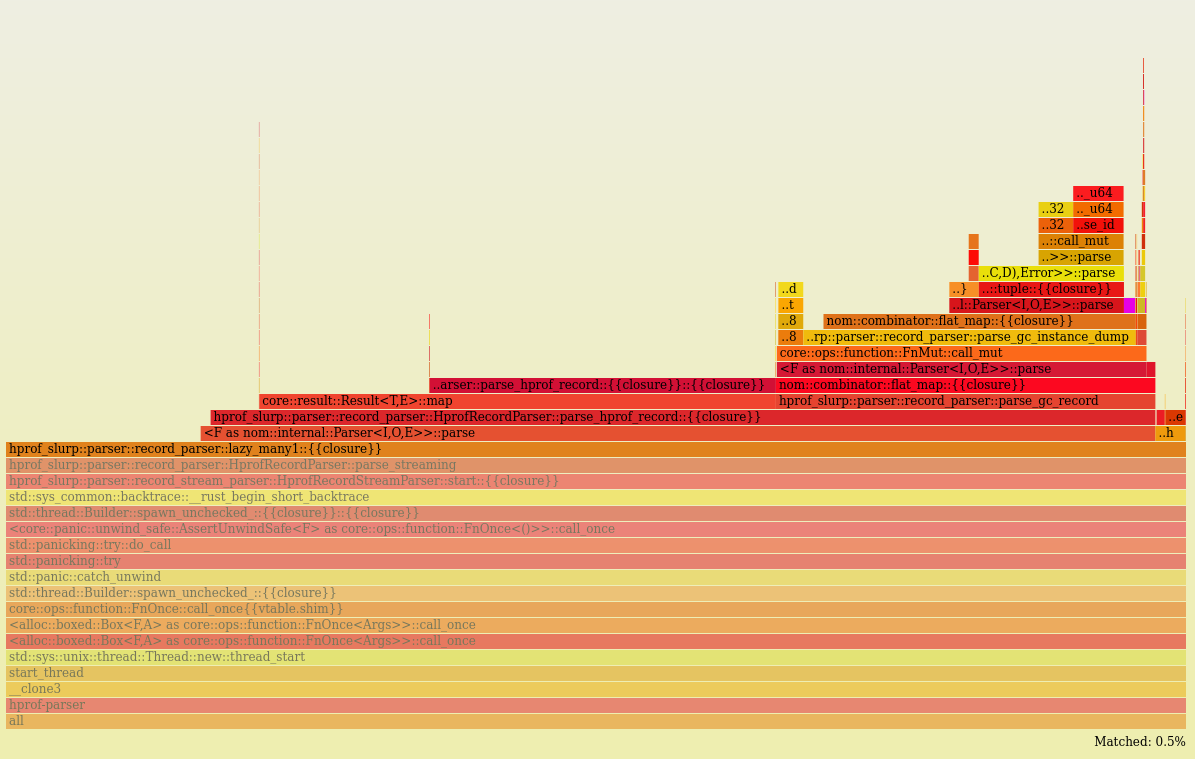
Most of it now comes from nom::combinator::flat_map and when zooming in we can also find a tiny contribution from nom::combinator::map.
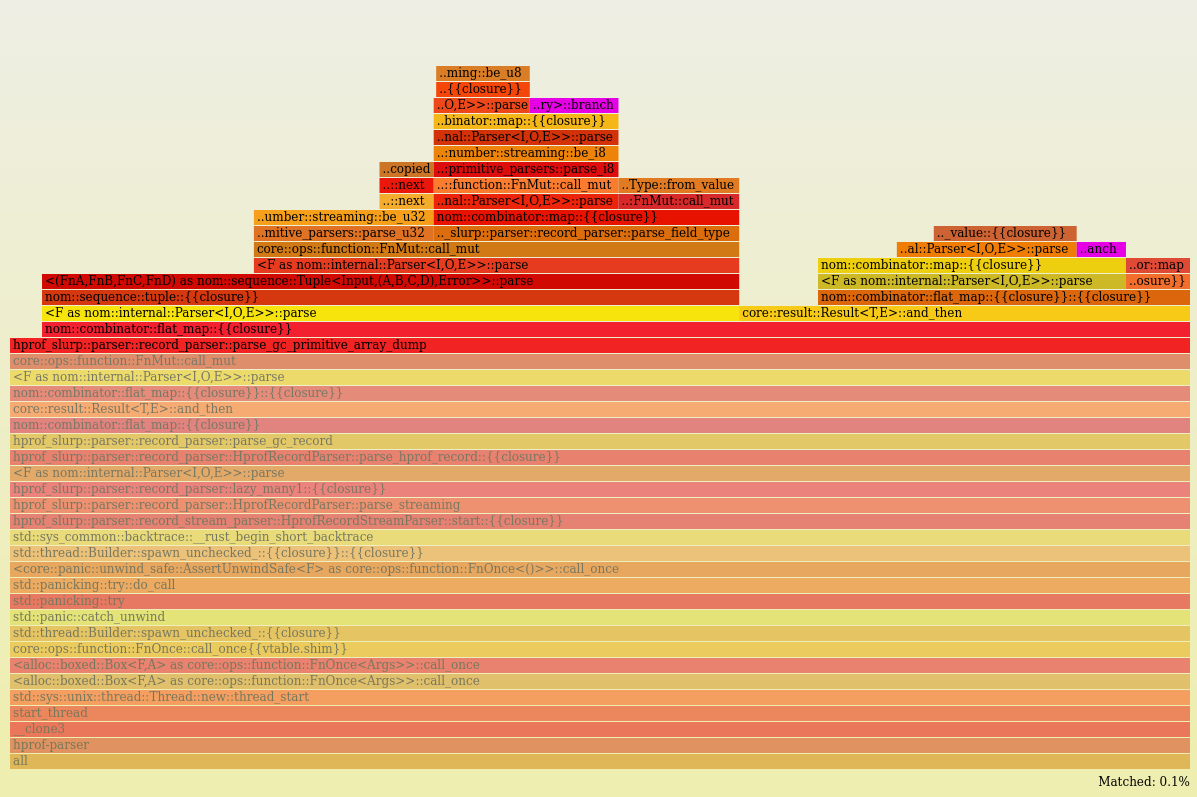
The previous occurrence of core::ops::try_trait::Try>::branch has been replaced by Result::map which informs us that our second change is executed more often.
Observing flamegraphs is nice but does it translate into runtime performance gains?
hyperfine --runs 10 \
 --warmup 5 \
 --export-markdown hprof.md \
 -n with-? "./hprof-slurp-with-? -i pets.bin" \
 -n with-combinators "./hprof-slurp-combinators -i pets.bin"
| Command | Mean [s] | Min [s] | Max [s] | Relative |
|---|---|---|---|---|
with-? | 36.614 ± 0.138 | 36.373 | 36.835 | 1.04 ± 0.02 |
with-combinators | 35.062 ± 0.766 | 34.202 | 35.969 | 1.00 |
Using the question mark operator is 4% slower than the combinators version on this run.
That is not a massive improvement, but I think it is a reasonable trade-off given the change applied and the application's context.
Going deeper
We can go deeper by applying the same tricks to nom to see if we can scrape some additional gains.
Let's clone the repository and apply the following changes.
First on the flat_map combinator.
pub fn flat_map<I, O1, O2, E: ParseError<I>, F, G, H>(
  mut parser: F,
  mut applied_parser: G,
) -> impl FnMut(I) -> IResult<I, O2, E>
where
  F: Parser<I, O1, E>,
  G: FnMut(O1) -> H,
  H: Parser<I, O2, E>,
{
   move |input: I| {
-    let (input, o1) = parser.parse(input)?;
-    applied_parser(o1).parse(input)
+    parser
+      .parse(input)
+      .and_then(|(input, o1)| applied_parser(o1).parse(input))
   }
}
And then for the map combinator.
pub fn map<I, O1, O2, E, F, G>(mut parser: F, mut f: G) -> impl FnMut(I) -> IResult<I, O2, E>
where
  F: Parser<I, O1, E>,
  G: FnMut(O1) -> O2,
{
-  move |input: I| {
-    let (input, o1) = parser.parse(input)?;
-    Ok((input, f(o1)))
-  }
+  move |input: I| parser.parse(input).map(|(input, o1)| (input, f(o1)))

}
In order to use our local patched version of nom, we simply need to tell Cargo about it.
 [dependencies]
-nom = "7.1.1"
+nom = { path = "../nom" }
This is a pretty neat feature from Cargo which enables quick experiments!
After validating that the flamegraph is now free from any traces of branch (trust me on this one, there are enough screenshots in this article), we can run a final benchmark.
hyperfine --runs 10 \
 --warmup 5 \
 --export-markdown hprof.md \
 -n with-? "./hprof-slurp-with-? -i pets.bin" \
 -n with-combinators "./hprof-slurp-combinators -i pets.bin"
 -n with-nom-combinators "./hprof-slurp-combinators -i pets.bin"
I re-ran the benchmark several times and the result is that the gain of the nom patch is more often 0% than 1%.
It is more or less what we could expect from optimizing a chunk of code accounting for 0.5% of the CPU time.
This means it is not worth it to make a PR to upstream the performance patch as we do not have enough data to back it up with.
An important aspect of performance work is that diminishing returns can occur quickly. Therefore, knowing when to stop digging in the same spot is essential.
Conclusion
In this article, we have learned that the question mark operator can have an impact on the runtime performance of a program.
How much of an impact, however, depends on the exact workload of the program and where the operator is used.
It seems reasonable to believe that this behaviour should not be an issue for the majority of Rust programs out there where the question mark operator is not used to shortcut very hot code.
As always, it is good to benchmark instead of making assumptions, which could lead to making the code less readable without concrete gains.
The next article in this series will go through another interesting optimization encountered while making hprof-slurp faster.