A performance retrospective using Rust (part 1)
This is the first article in a series regarding making a simple JVM heap dump analyzer in Rust faster over time.
Although it is primarily targeted at intermediate Rust developers, it will surely be relevant for engineers interested in performance in general.
Performance optimization is highly context-dependent so it makes sense to spend some time explaining what problem we are trying to solve.
Context
In a previous life, I found myself needing to analyze large JVM heap dumps. For a sense of scale, "large" stands for more than 50Gb in that context.
The JVM ecosystem is pretty rich in terms of tooling regarding heap dump analysis. Most JVM developers are familiar with VisualVM and EclipseMat.
Those tools are truly excellent; they offer a large panel of features to drill down on the content of heap dumps to help you pinpoint your issue very precisely.
However, they tend to be extremely memory hungry and slow when analyzing large files, which is forcing users to spin up expensive beefy instances from a cloud provider to get the job done.
The tool I needed was fairly specific, my main concern was to get a quick overview of large heap dumps using a regular developer machine to decide if it actually makes sense to investigate further using the aforementioned workflow.
The goal is not to replace the existing tooling but to optimize the investigation workflow and this led me to create the hprof-slurp project.
Hprof-slurp
The project is a CLI written in Rust which processes dump files in a streaming fashion.
It trades off features for speed by performing only a single pass without storing intermediary results on the host, which reduces the depth of the analysis possible.
The project is named after the hprof format which is used by the JDK to encode heap dumps.
The 3 main features available are:
- report top
kallocated classes. - report the count of instances per class.
- report the largest instance size per class.
Let's have a look at an example of output processing: a tiny heap dump which is used as part of the integration test pipeline.
du -BM hprof-64.bin
2M hprof-64.bin
Let's process that 2Mb heap dump!
./hprof-slurp -i "hprof-64.bin"
Which instantaneously yields those two tables
Top 20 allocated classes:

Total size | Instances |     Largest | Class name
------------------------------------------------------------------------------------
   1.99MiB |       436 |   634.78KiB | int[]
 197.11KiB |      1991 |    16.02KiB | char[]
  85.25KiB |       443 |     8.02KiB | byte[]
  47.38KiB |      1516 |  32.00bytes | java/lang/String
  45.42KiB |       560 |     8.02KiB | java/lang/Object[]
  15.26KiB |       126 | 124.00bytes | java/lang/reflect/Field
  14.77KiB |       378 |  40.00bytes | java/util/LinkedList$Node
   9.94KiB |       212 |  48.00bytes | java/util/HashMap$Node
   8.91KiB |       190 |  48.00bytes | java/util/LinkedList
   8.42KiB |        98 |  88.00bytes | java/lang/ref/SoftReference
   6.05KiB |       258 |  24.00bytes | java/lang/Integer
   5.91KiB |        18 |     2.02KiB | java/util/HashMap$Node[]
   5.86KiB |       150 |  40.00bytes | java/lang/StringBuilder
   5.44KiB |       116 |  48.00bytes | java/util/Hashtable$Entry
   5.05KiB |        38 | 136.00bytes | sun/util/locale/LocaleObjectCache$CacheEntry
   5.00KiB |        40 | 128.00bytes | java/lang/ref/Finalizer
   3.50KiB |        32 | 112.00bytes | java/net/URL
   3.42KiB |        73 |  48.00bytes | java/io/File
   3.17KiB |        12 | 776.00bytes | java/util/Hashtable$Entry[]
   3.13KiB |        56 | 144.00bytes | java/lang/String[]

Top 20 largest instances:

 Total size | Instances |     Largest | Class name
--------------------------------------------------------------------------------------
    1.99MiB |       436 |   634.78KiB | int[]
  197.11KiB |      1991 |    16.02KiB | char[]
   85.25KiB |       443 |     8.02KiB | byte[]
   45.42KiB |       560 |     8.02KiB | java/lang/Object[]
    5.91KiB |        18 |     2.02KiB | java/util/HashMap$Node[]
    2.05KiB |         2 |     2.02KiB | java/lang/invoke/MethodHandle[]
    2.02KiB |         1 |     2.02KiB | java/lang/Integer[]
    3.17KiB |        12 | 776.00bytes | java/util/Hashtable$Entry[]
462.00bytes |         1 | 462.00bytes | sun/misc/Launcher$AppClassLoader
454.00bytes |         1 | 454.00bytes | sun/misc/Launcher$ExtClassLoader
680.00bytes |         2 | 340.00bytes | simple/Producer
680.00bytes |         2 | 340.00bytes | simple/Consumer
    2.30KiB |         7 | 336.00bytes | java/util/jar/JarFile$JarFileEntry
334.00bytes |         1 | 334.00bytes | java/lang/ref/Finalizer$FinalizerThread
332.00bytes |         1 | 332.00bytes | java/lang/ref/Reference$ReferenceHandler
    1.01KiB |         9 | 312.00bytes | java/lang/reflect/Field[]
    1.48KiB |         7 | 272.00bytes | java/util/concurrent/ConcurrentHashMap$Node[]
236.00bytes |         1 | 236.00bytes | sun/net/www/protocol/file/FileURLConnection
440.00bytes |         2 | 220.00bytes | java/io/ExpiringCache$1
432.00bytes |         2 | 216.00bytes | java/lang/NoSuchMethodError
And that's all there is to it.
Architecture
As mentioned previously, the CLI is written in Rust and works in a synchronous multithreaded fashion.
Here is a simplified architecture diagram for the current version (0.4.7).
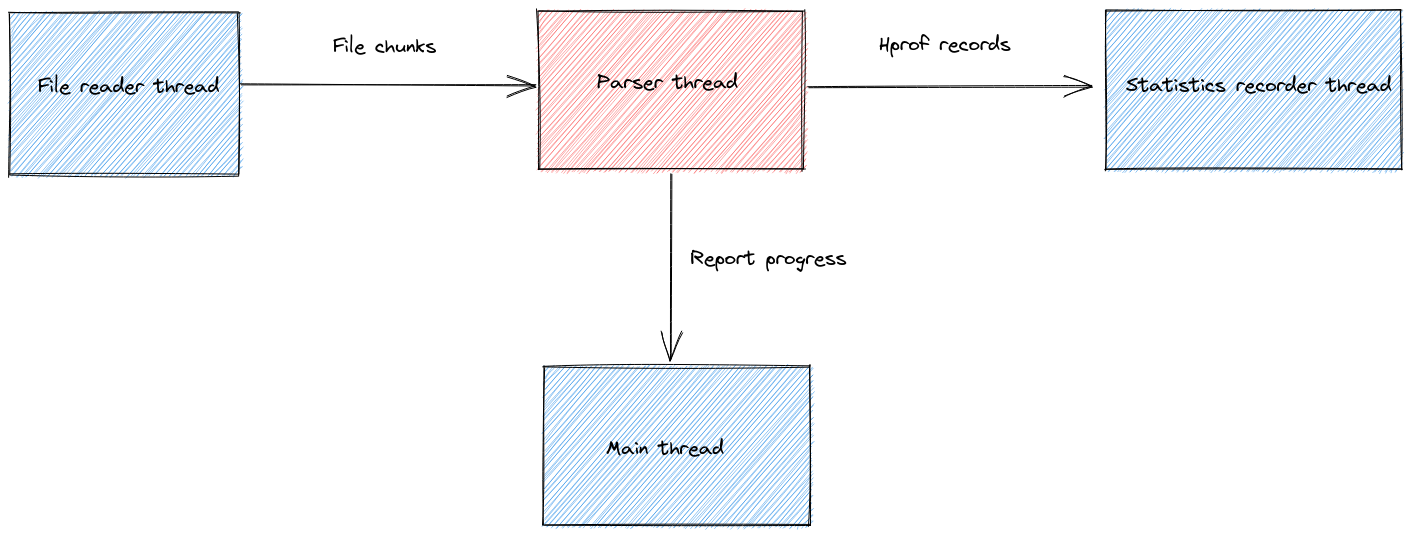
The various threads are wired up together via channels to form a processing pipeline where all stages run in parallel (if the host has enough cores).
The file reader thread proactively loads chunks of 64Mb from the input file to not starve the rest of the pipeline while waiting for IO. Loading too many chunks in advance has a direct impact on the memory usage, so I settled on 3 chunks based on experiments.
Those chunks are then sent over to the streaming parser which was the most challenging work of the project because it must handle incomplete inputs.
A single chunk can contain millions of records, and a chunk is of course not aligned on the actual boundary of the hprof records.
Therefore, the parser tries to make sense of the incoming binary data while carefully managing its inner buffer.
More concretely, it has been written by following the full specification of the hprof format found in the heap dumper code of the JDK.
The parser itself is written with the nom library, which I found a real pleasure to work with due to its support for parsing incomplete data.
As the content of the file is streamed through the parser, the classes information is extracted and forwarded to the statistics recorder thread which keeps track of the instance counts in order to later compute the heavy hitters.
Spoiler alert: as of version 0.4.7, the performance bottleneck is the parsing thread.
Speeding up other stages of the pipeline would not yield any performance improvements.
Test data
We are about to do some performance testing, which means we need some meaningful test data.
For the sake of transparency or reproducibility, I will show you exactly how to generate a similar heap dump.
To avoid completely synthetic data, we will be using Spring's REST petclinic.
It is a reasonable choice because it is relatively well known, and it uses an in-memory database by default which naturally amplifies the memory usage.
In order to not waste too much time growing the heap, we will simply use the Java Epsilon GC which does not clean up anything.
This is the change to apply if you want to try this at home.
git diff
diff --git a/pom.xml b/pom.xml
index b936a37..7621eb9 100644
--- a/pom.xml
+++ b/pom.xml
@@ -165,6 +165,15 @@
             <plugin>
                 <groupId>org.springframework.boot</groupId>
                 <artifactId>spring-boot-maven-plugin</artifactId>
+                <configuration>
+                    <executable>true</executable>
+                    <jvmArguments>
+                        -Xmx32g
+                        -XX:+UnlockExperimentalVMOptions
+                        -XX:+UseEpsilonGC
+                    </jvmArguments>
+                </configuration>
                 <executions>
                     <execution>
You could also add -XX:+HeapDumpOnOutOfMemoryError if you prefer to produce a heap dump whenever an OutOfMemoryError is thrown instead of performing the dump manually.
In any case we can start the application using Maven.
./mvnw spring-boot:run
In order to increase the memory pressure, we will gently hammer one of the REST endpoints using Hey.
hey -m POST \
 -D ./payload-owner.json \
 -T application/json \
 -A application/json \
 -z 3m \
 -c 50 \
 http://127.0.0.1:9966/petclinic/api/owners
With the following payload-owner.json
{
  "address": "110 W. Liberty St.",
  "city": "Madison",
  "firstName": "George",
  "lastName": "Franklin",
  "telephone": "6085551023"
}
Once the desired heap size is reached, we can generate a heap dump with jmap.
jmap -dump:format=b,file=pets.bin <pid>
Which gives us a decent 34Gb heap dump file to play with.
du -BM pets.bin
34486M pets.bin
Let's see what hprof-slurp has to say about it.
./hprof-slurp -i "pets.bin"
Top 20 allocated classes:

Total size | Instances |     Largest | Class name
-----------------------------------------------------------------------------------------------------------------------------------
   4.02GiB |  90184199 |   544.20KiB | byte[]
   2.13GiB |  55748013 |   109.80KiB | java/lang/Object[]
   1.72GiB |  51264762 |  36.00bytes | java/lang/String
   1.57GiB |  14807226 | 114.00bytes | org/hibernate/validator/internal/engine/path/NodeImpl
   1.18GiB |   8536353 | 148.00bytes | java/nio/HeapByteBuffer
   1.03GiB |  18074217 |     3.75MiB | int[]
1022.73MiB |   5765654 | 186.00bytes | java/lang/reflect/Method
1021.18MiB |  26769597 |  40.00bytes | java/util/ArrayList
 896.73MiB |  21370207 |  44.00bytes | java/lang/StringBuilder
 838.65MiB |   7594346 |    16.02KiB | java/util/HashMap$Node[]
 744.79MiB |   5276798 | 148.00bytes | java/nio/StringCharBuffer
 743.57MiB |   5340350 | 146.00bytes | java/util/LinkedHashMap
 631.70MiB |   6899814 |  96.00bytes | java/util/regex/Matcher
 606.64MiB |   6490868 |  98.00bytes | org/hibernate/validator/internal/engine/constraintvalidation/ConstraintValidatorContextImpl
 605.70MiB |    610435 |   128.02KiB | java/util/concurrent/ConcurrentHashMap$Node[]
 584.97MiB |  14604425 |  42.00bytes | org/hibernate/validator/internal/engine/path/PathImpl
 556.55MiB |  14589693 |  40.00bytes | java/util/ArrayList$Itr
 520.24MiB |   6818920 |  80.00bytes | java/util/HashMap
 425.14MiB |   8330358 |    32.02KiB | char[]
 424.89MiB |   9281863 |  48.00bytes | java/util/HashMap$Node

Top 20 largest instances:

Total size | Instances |   Largest | Class name
--------------------------------------------------------------------------------------------------------
   1.03GiB |  18074217 |   3.75MiB | int[]
   4.02GiB |  90184199 | 544.20KiB | byte[]
 605.70MiB |    610435 | 128.02KiB | java/util/concurrent/ConcurrentHashMap$Node[]
   2.13GiB |  55748013 | 109.80KiB | java/lang/Object[]
 425.14MiB |   8330358 |  32.02KiB | char[]
  13.70MiB |    211087 |  24.02KiB | long[]
   5.81MiB |      3456 |  16.07KiB | jdk/internal/org/objectweb/asm/SymbolTable$Entry[]
 314.02KiB |       159 |  16.07KiB | org/springframework/asm/SymbolTable$Entry[]
 838.65MiB |   7594346 |  16.02KiB | java/util/HashMap$Node[]
  81.18MiB |   2093066 |   9.05KiB | java/lang/String[]
 432.84KiB |        54 |   8.02KiB | java/nio/ByteBuffer[]
  15.83KiB |         2 |   7.91KiB | java/util/Locale[]
  13.94MiB |    405627 |   4.67KiB | java/lang/Object[]
  30.21KiB |        12 |   4.02KiB | net/bytebuddy/jar/asm/SymbolTable$Entry[]
  47.46MiB |    214730 |   3.01KiB | java/lang/reflect/Method[]
   4.23KiB |         6 |   2.97KiB | [[B[]
   2.84KiB |         1 |   2.84KiB | java/lang/Character$UnicodeBlock[]
   2.67KiB |         1 |   2.67KiB | jdk/internal/math/FDBigInteger[]
   4.28KiB |         2 |   2.14KiB | sun/security/util/KnownOIDs[]
   2.11KiB |         1 |   2.11KiB | org/springframework/boot/web/embedded/tomcat/TomcatEmbeddedContext
This output looks about right for an application using an in-memory database. We find the usual suspects regarding various arrays, HashMap nodes and Strings.
Performance over time
It is often interesting to track the performance of a piece of software over time to be able to attribute gains to precise changes.
Sometimes a single line change can have a tremendous effect, and sometimes a complete change of architecture is required to remove a bottleneck.
Using the benchmarking tool hyperfine we are able to measure accurately the execution time of our CLI in a blackbox fashion.
For reference, I will be running the benchmarks on a laptop running Linux on an Intel i7-10610U CPU.
In this comparison analysis, we are interested in the relative speedup between releases and not the absolute durations, which are mostly a function of the dump size given a stable throughput.
After downloading all the versions of hprof-slurp into the same directory, we can compare how they handle the pets.bin heap dump using the following hyperfine magic incantation.
hyperfine --runs 3 \
 --export-markdown hprof.md \
 --export-json hprof.json \
 -n 0.1.0 "./hprof-slurp-0.1.0 -i pets.bin" \
 -n 0.2.0 "./hprof-slurp-0.2.0 -i pets.bin" \
 -n 0.2.1 "./hprof-slurp-0.2.1 -i pets.bin" \
 -n 0.2.2 "./hprof-slurp-0.2.2 -i pets.bin" \
 -n 0.3.0 "./hprof-slurp-0.3.0 -i pets.bin" \
 -n 0.3.1 "./hprof-slurp-0.3.1 -i pets.bin" \
 -n 0.3.2 "./hprof-slurp-0.3.2 -i pets.bin" \
 -n 0.3.3 "./hprof-slurp-0.3.3 -i pets.bin" \
 -n 0.4.0 "./hprof-slurp-0.4.0 -i pets.bin" \
 -n 0.4.1 "./hprof-slurp-0.4.1 -i pets.bin" \
 -n 0.4.2 "./hprof-slurp-0.4.2 -i pets.bin" \
 -n 0.4.3 "./hprof-slurp-0.4.3 -i pets.bin" \
 -n 0.4.4 "./hprof-slurp-0.4.4 -i pets.bin" \
 -n 0.4.5 "./hprof-slurp-0.4.5 -i pets.bin" \
 -n 0.4.6 "./hprof-slurp-0.4.6 -i pets.bin" \
 -n 0.4.7 "./hprof-slurp-0.4.7 -i pets.bin"
Which - after a long time - yields the following Markdown table in hprof.md.
| Command | Mean [s] | Min [s] | Max [s] | Relative |
|---|---|---|---|---|
0.1.0 | 131.227 ± 4.072 | 126.660 | 134.475 | 3.83 ± 0.12 |
0.2.0 | 119.450 ± 0.244 | 119.206 | 119.694 | 3.49 ± 0.03 |
0.2.1 | 119.038 ± 0.513 | 118.452 | 119.405 | 3.47 ± 0.03 |
0.2.2 | 92.710 ± 0.893 | 91.685 | 93.324 | 2.71 ± 0.03 |
0.3.0 | 84.097 ± 0.159 | 83.953 | 84.268 | 2.45 ± 0.02 |
0.3.1 | 81.579 ± 0.073 | 81.497 | 81.639 | 2.38 ± 0.02 |
0.3.2 | 81.255 ± 0.211 | 81.028 | 81.445 | 2.37 ± 0.02 |
0.3.3 | 77.121 ± 0.228 | 76.937 | 77.376 | 2.25 ± 0.02 |
0.4.0 | 67.911 ± 0.979 | 66.826 | 68.728 | 1.98 ± 0.03 |
0.4.1 | 65.925 ± 0.344 | 65.645 | 66.309 | 1.92 ± 0.02 |
0.4.2 | 65.779 ± 0.240 | 65.602 | 66.053 | 1.92 ± 0.02 |
0.4.3 | 63.398 ± 0.104 | 63.291 | 63.499 | 1.85 ± 0.02 |
0.4.4 | 35.473 ± 0.047 | 35.444 | 35.527 | 1.04 ± 0.01 |
0.4.5 | 34.695 ± 0.302 | 34.440 | 35.028 | 1.01 ± 0.01 |
0.4.6 | 34.285 ± 0.048 | 34.254 | 34.340 | 1.00 ± 0.01 |
0.4.7 | 34.264 ± 0.289 | 34.000 | 34.574 | 1.00 |
And using the hprof.json file and some python scripts we generate the following whisker graph.
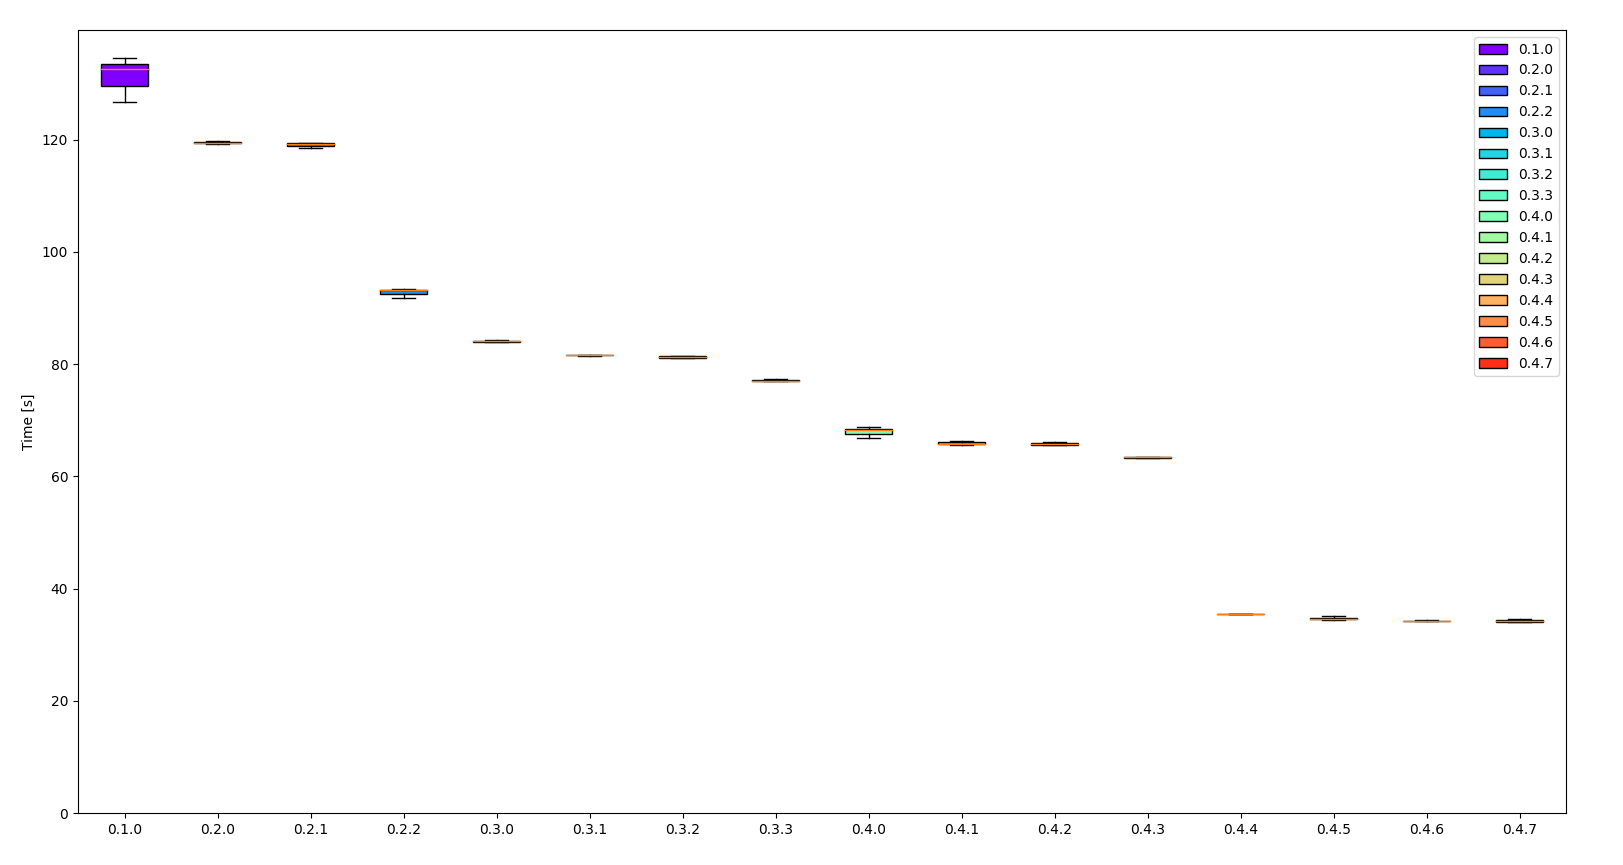
Some observations:
- the throughput increased by more than 70%
- 0.1.0 has a large variance (might be a warmup issue)
- starting from 0.4.5 the iterative improvement is minimal
In any case, we reached a solid 1Gb/s throughput in the latest version given the size of our test file.
Let's have a look at the peak memory consumption for 0.4.7 using Heaptrack.
heaptrack ./hprof-slurp-0.4.7 -i pets.bin
This opens up the UI directly after the run if it is installed.
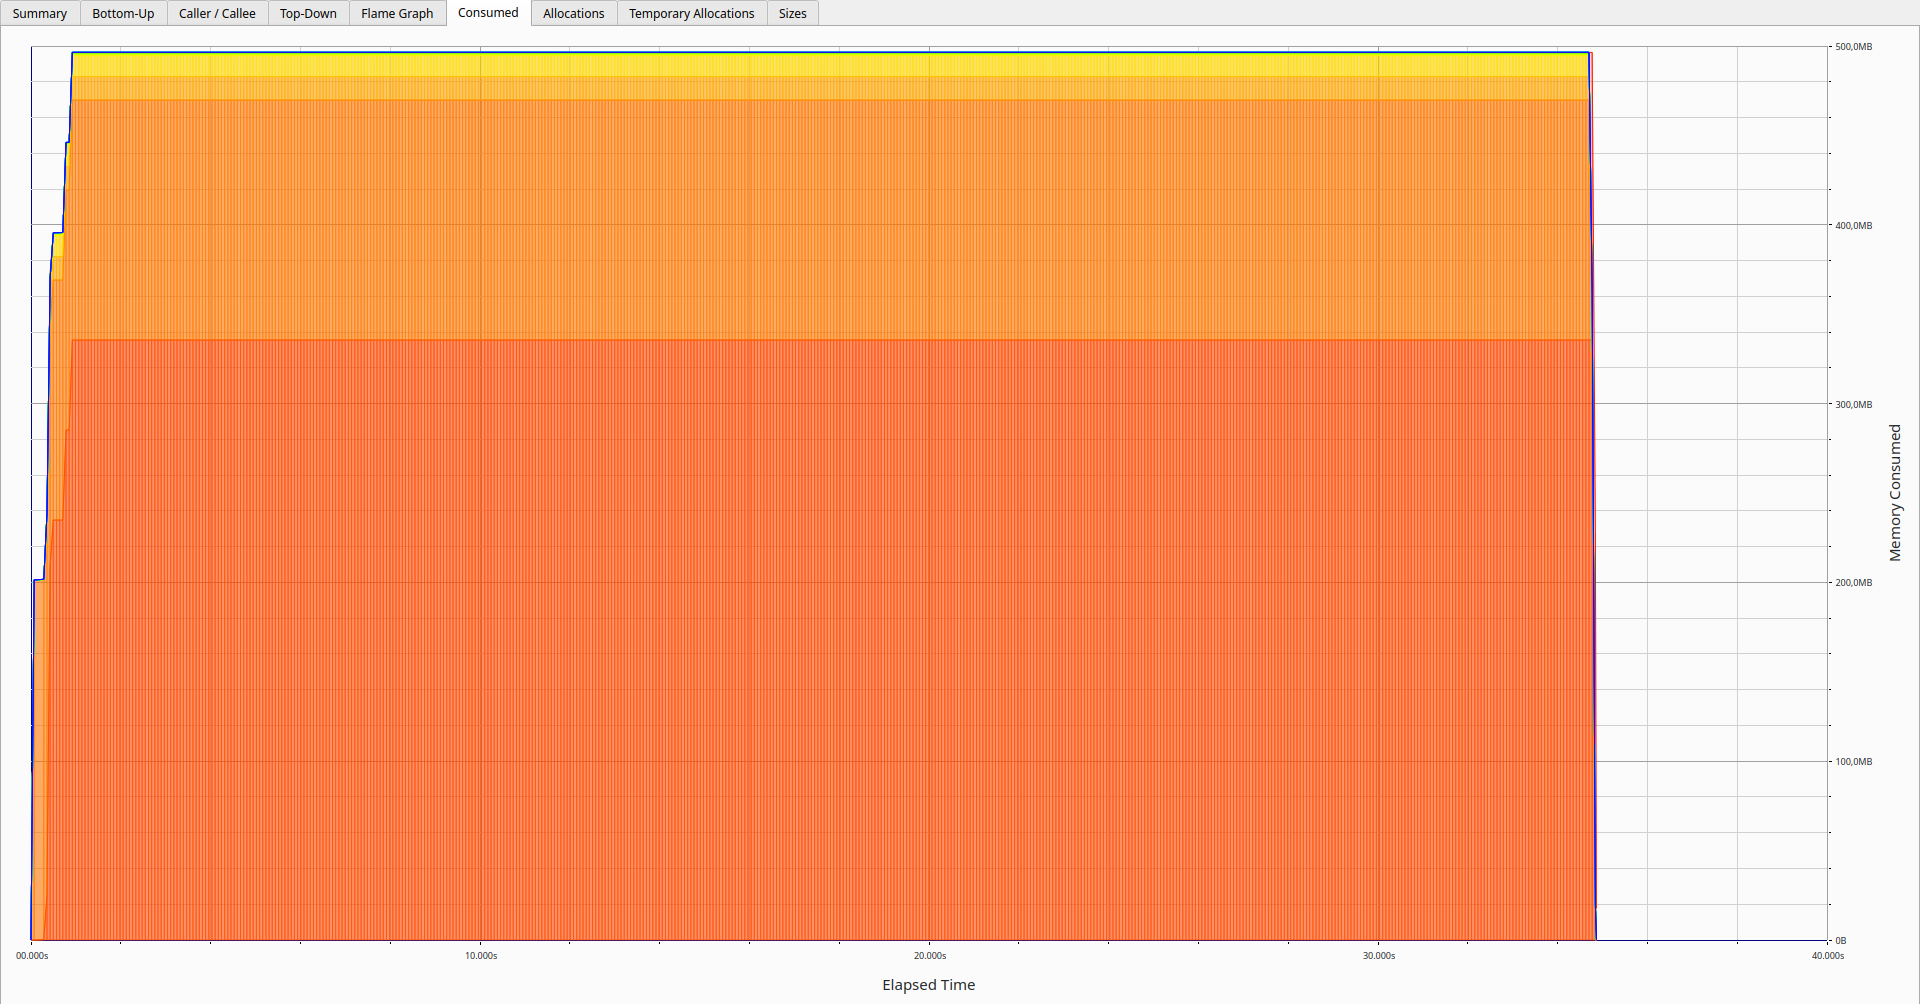
The memory usage is pretty stable; it seems we have been able to stream the whole 34 Gb file within 500Mb.
Most of it is actually due to the various internal buffers which are used to communicate between the threads. Those are pre-allocated and can grow to a certain size before being shrunk to release the memory.
One could expect a stable similar memory usage for much larger dumps unless those contain large arrays of primitives or objects which need to be parsed.
Future work
Obviously, I am still interested in making hprof-slurp faster — hopefully not at the expense of code readability.
Outside the performance concern, I believe the output could still be improved to be more useful.
First, I would like to validate the precision of the statistics reported by comparing the output of hprof-slurp against the existing tools. My gut feeling is that the numbers are not too far off and serve as a pretty good proxy.
Moreover, additional extractions could be performed as long as it happens in a single pass, such as rendering the complete thread stack traces at the moment of the heap dump.
Feel free to reach out if you have suggestions.
Conclusion
This article has shown that hprof-slurp has gotten faster over time and that it is now processing heap dumps at around 1Gb/s.
It fulfills the initial goal, which was to offer a quick overview of large heap dumps using a regular developer machine.
The next articles in this series will go through a selection of the most interesting optimizations that had the largest impact on performance.
In the meantime, you can try to reproduce those results or, even better, analyze larger real-world heap dumps!