A performance retrospective using Rust (part 2)
This article is the second part of a performance retrospective regarding the hprof-slurp project. It is highly recommended to start with the first part to get a good grasp of the context.
We left off after a presentation of the project and a detailed description of the benchmarking methodology used to measure performance gains.
In this article we will focus on a specific issue that has been plaguing the 0.3.x series.
Avoiding memcopy
As the program got faster, I witnessed the memcpy instructions slowly creeping up in the flamegraphs to the point where they accounted for most of the computation.
Below - in purple - you can see the _memcpy_avx_unaligned_erms representing most of the work in the parser thread (full flamegraph).
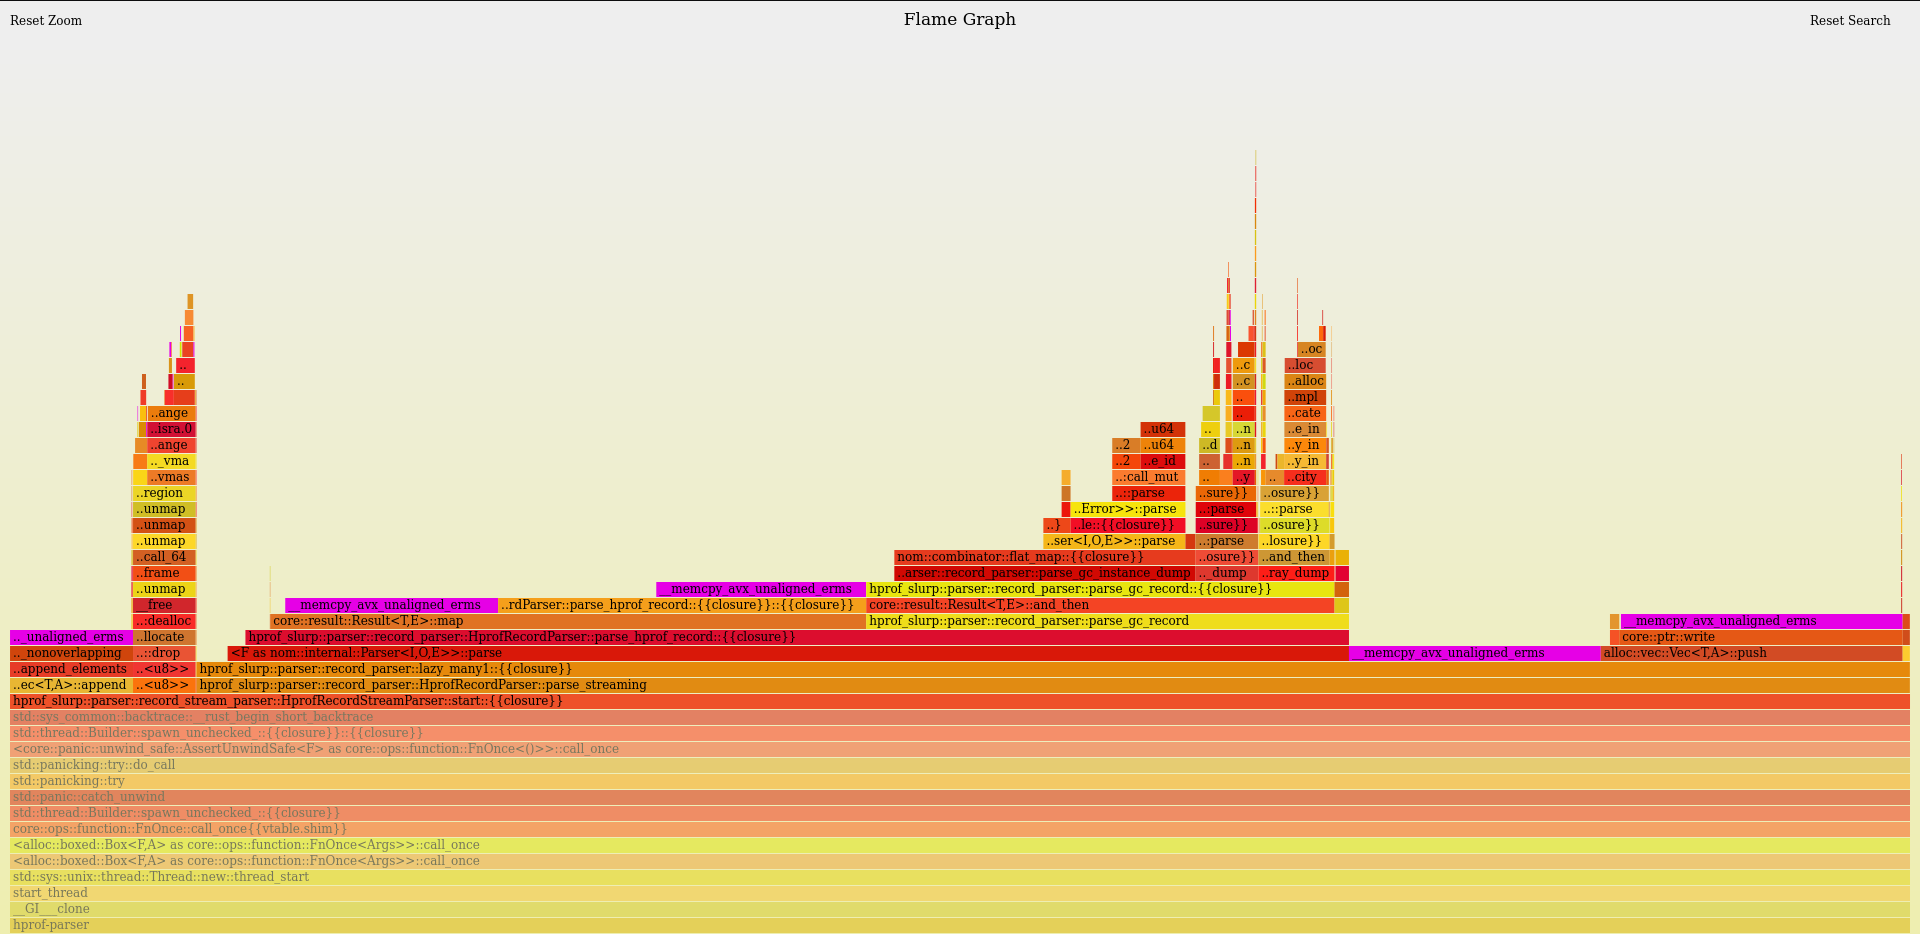
At first, I thought it was an inherent cost of parsing large files, but as it grew to become the largest bottleneck in hprof-slurp, I decided to investigate the issue to - at the very least - understand it.
I found the answer to this mystery in the fantastic Rust performance book.
Rust types that are larger than 128 bytes are copied with memcpy rather than inline code. Shrinking these types to 128 bytes or less can make the code faster by avoiding memcpy calls and reducing memory traffic.
Therefore, within my code I needed to find the large types that are used very often on the parser's path.
Let's generate the type sizes with:
RUSTFLAGS=-Zprint-type-sizes cargo +nightly build --release
In my opinion, it can be a bit cumbersome to navigate the output of -Zprint-type-sizes.
One alternative recommended by the Rust performance book is to use DHAT’s “copy profiling” mode, which works great as well.
I will stick to -Zprint-type-sizes for the remainder of the article as it helps understand the memory layout on the way.
Looking at the types I own in the output section, we can find the following
print-type-size type: `parser::record::Record`: 136 bytes, alignment: 8 bytes
print-type-size     discriminant: 2 bytes
print-type-size     variant `GcSegment`: 134 bytes
print-type-size         padding: 6 bytes
print-type-size         field `.0`: 128 bytes, alignment: 8 bytes
print-type-size     variant `AllocationSites`: 62 bytes
print-type-size         field `.flags`: 2 bytes
print-type-size         field `.cutoff_ratio`: 4 bytes
print-type-size         field `.total_live_bytes`: 4 bytes
print-type-size         field `.total_live_instances`: 4 bytes
print-type-size         field `.number_of_sites`: 4 bytes
print-type-size         padding: 4 bytes
print-type-size         field `.total_bytes_allocated`: 8 bytes, alignment: 8 bytes
print-type-size         field `.total_instances_allocated`: 8 bytes
print-type-size         field `.allocation_sites`: 24 bytes
... more variants with decreasing size
The parser::record::Record is an enum which represents all possible top-level records found in an hprof file.
The largest variant is GcSegment, with 134 bytes, which is larger than the 128 bytes mentioned above.
The corresponding Rust code looks like the following:
pub enum Record {
  GcSegment(GcRecord),
  AllocationSites {
    flags: u16,
    cutoff_ratio: u32,
    total_live_bytes: u32,
    total_live_instances: u32,
    total_bytes_allocated: u64,
    total_instances_allocated: u64,
    number_of_sites: u32,
    allocation_sites: Vec<AllocationSite>,
  },
  ... more variants
}
The parser::gc_record::GcRecord is itself an enum as well. It models all possible elements found on the JVM's heap.
Let's find in the output the size of a GcRecord.
print-type-size type: `parser::gc_record::GcRecord`: 128 bytes, alignment: 8 bytes
print-type-size     discriminant: 1 bytes
print-type-size     variant `ClassDump`: 127 bytes
print-type-size         padding: 1 bytes
print-type-size         field `.constant_pool_size`: 2 bytes, alignment: 2 bytes
print-type-size         field `.stack_trace_serial_number`: 4 bytes
print-type-size         field `.instance_size`: 4 bytes
print-type-size         padding: 4 bytes
print-type-size         field `.class_object_id`: 8 bytes, alignment: 8 bytes
print-type-size         field `.super_class_object_id`: 8 bytes
print-type-size         field `.class_loader_object_id`: 8 bytes
print-type-size         field `.signers_object_id`: 8 bytes
print-type-size         field `.protection_domain_object_id`: 8 bytes
print-type-size         field `.const_fields`: 24 bytes
print-type-size         field `.static_fields`: 24 bytes
print-type-size         field `.instance_fields`: 24 bytes
print-type-size     variant `ObjectArrayDump`: 55 bytes
print-type-size         padding: 3 bytes
print-type-size         field `.stack_trace_serial_number`: 4 bytes, alignment: 4 bytes
print-type-size         field `.number_of_elements`: 4 bytes
print-type-size         padding: 4 bytes
print-type-size         field `.object_id`: 8 bytes, alignment: 8 bytes
print-type-size         field `.array_class_id`: 8 bytes
print-type-size         field `.elements`: 24 bytes
... more variant with decreasing size
For the following definition:
pub enum GcRecord {
    ClassDump {
        class_object_id: u64,
        stack_trace_serial_number: u32,
        super_class_object_id: u64,
        class_loader_object_id: u64,
        signers_object_id: u64,
        protection_domain_object_id: u64,
        instance_size: u32,
        constant_pool_size: u16,
        const_fields: Vec<(ConstFieldInfo, FieldValue)>,
        static_fields: Vec<(FieldInfo, FieldValue)>,
        instance_fields: Vec<FieldInfo>,
    },
    ObjectArrayDump {
        object_id: u64,
        stack_trace_serial_number: u32,
        number_of_elements: u32,
        array_class_id: u64,
        elements: Vec<u64>,
    },
    ... more variants
}
At this point, we can see that there is logically a direct mapping between the fields of the structs and their actual sizes.
Moreover, there is a critical observation to make regarding enums.
Enums are sized according to the largest variant.
An enum is sized with its largest variant plus some memory for an internal discriminant field.
This means the 134 bytes for a GcSegment are being allocated for every parser::record::Record variant.
This quickly adds up when a program is crunching millions of records.
The common wisdom for decreasing the stack memory footprint is to use heap allocation, often referred to as boxing.
Let's try boxing the content of GcSegment.
GcSegment(Box<GcRecord>),
This change gives the following type sizes (after applying the necessary modifications to handle the new Box type at the call sites).
print-type-size type: `parser::record::Record`: 64 bytes, alignment: 8 bytes
print-type-size     discriminant: 2 bytes
print-type-size     variant `AllocationSites`: 62 bytes
print-type-size         field `.flags`: 2 bytes
print-type-size         field `.cutoff_ratio`: 4 bytes
print-type-size         field `.total_live_bytes`: 4 bytes
print-type-size         field `.total_live_instances`: 4 bytes
print-type-size         field `.number_of_sites`: 4 bytes
print-type-size         padding: 4 bytes
print-type-size         field `.total_bytes_allocated`: 8 bytes, alignment: 8 bytes
print-type-size         field `.total_instances_allocated`: 8 bytes
print-type-size         field `.allocation_sites`: 24 bytes
... more variant with decreasing size
print-type-size     variant `GcSegment`: 14 bytes
print-type-size         padding: 6 bytes
print-type-size         field `.0`: 8 bytes, alignment: 8 bytes
Looking good!
The type parser::record::Record went from 136 bytes to 64 bytes because all variants are now sized according to the next largest variant, AllocationSites at 62 bytes.
The memcpy should not be a problem anymore.
hyperfine --runs 3 \
 --export-markdown hprof.md \
 -n 0.3.3 "./hprof-slurp-0.3.3 -i pets.bin" \
 -n box "./hprof-slurp -i pets.bin"
| Command | Mean [s] | Min [s] | Max [s] | Relative |
|---|---|---|---|---|
0.3.3 | 77.442 ± 2.537 | 74.513 | 78.968 | 1.00 |
box | 270.785 ± 0.907 | 270.031 | 271.792 | 3.50 ± 0.12 |
Ouch! It is over three times slower!
Let's have a look at the flamegraph to understand where the CPU spends its time.
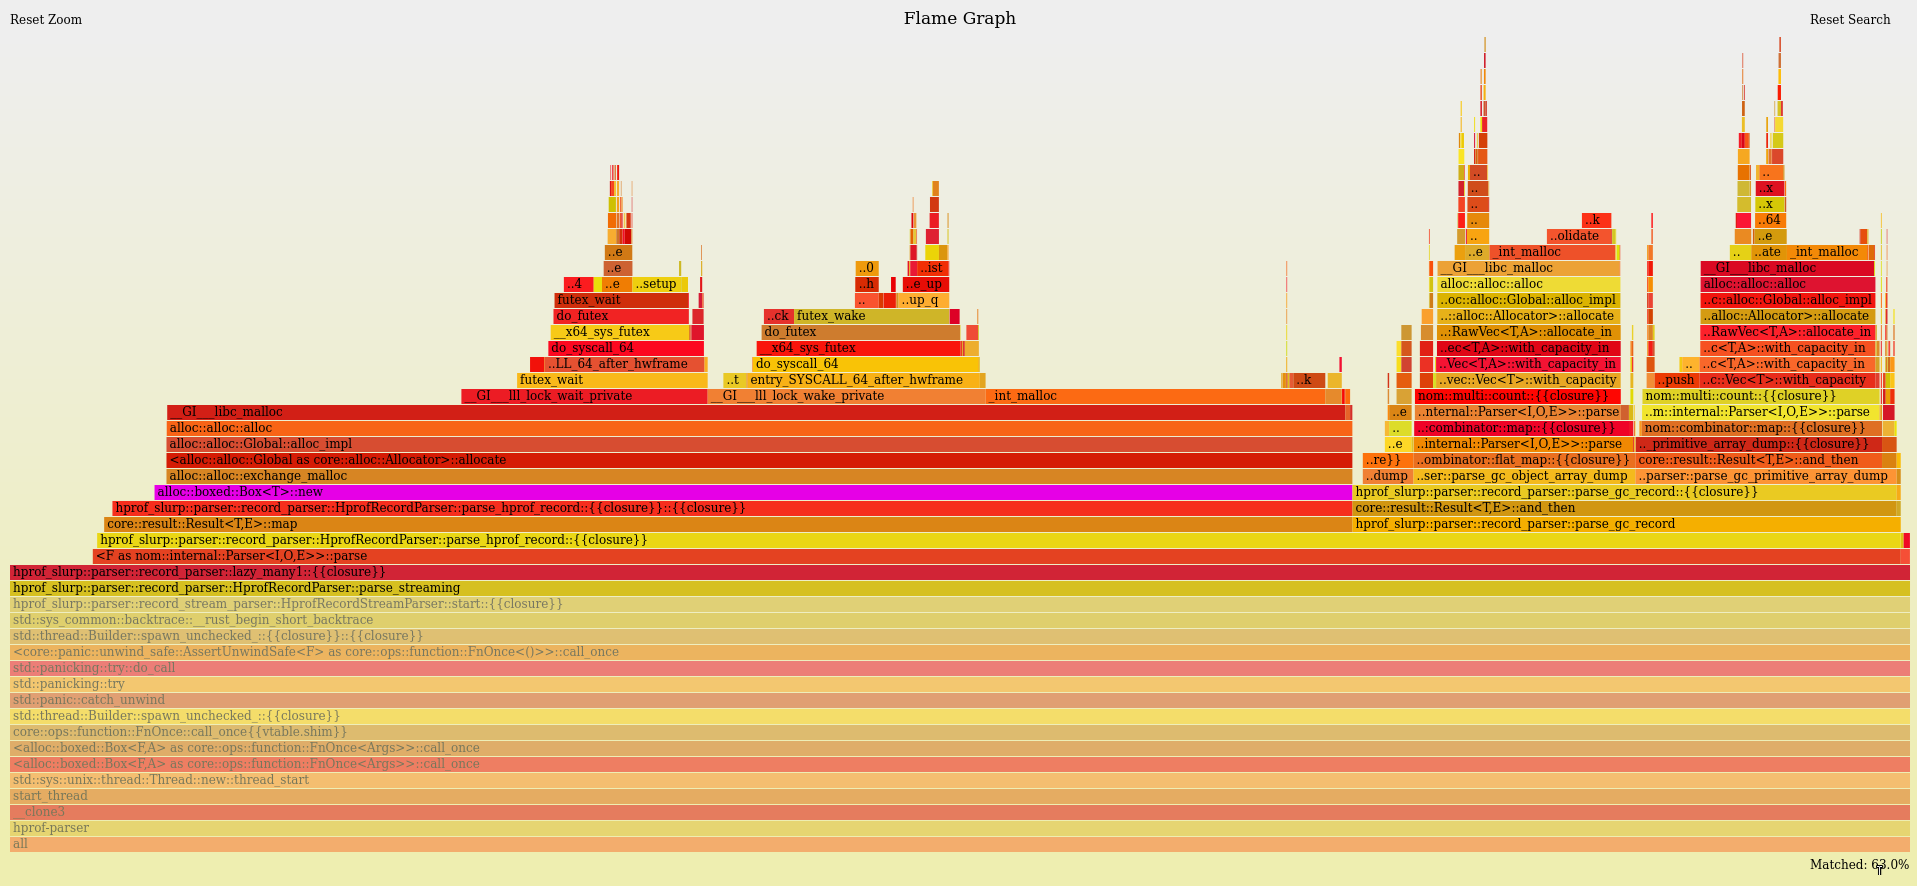
In purple, you can see the cost of Box::new in the parser thread (full flamegraph available).
Welp, we did fix the memcpy issue, but the application is terribly slow.
Boxing is, unfortunately, not some kind of magic sauce that will fix all our problems.
Performing heap allocation has a higher cost than stack allocation, and we are now performing it for each instance found in the JVM heap dump.
Reasonable boxing
In the previous section, we have seen that GcSegment cannot be boxed efficiently because it appears too frequently during the execution of the application.
We also have seen that the largest variant of GcSegment is ClassDump, clocking in at 127 bytes.
Based on the enumeration sizing discovery, we know that the 127 bytes for a ClassDump are being allocated for every GcSegment record.
However, the ClassDump is a relatively rare element compared to the actual instance dumps. An application has a few hundred classes but millions of instances.
It is unfortunate to systematically pay the full price for something that is infrequent.
The intuition is that we should be moving the boxing cost to the ClassDump only.
Let's try to box the individual fields in ClassDump instead.
pub enum GcRecord {
    ClassDump {
        class_object_id: u64,
        stack_trace_serial_number: u32,
        super_class_object_id: u64,
        class_loader_object_id: u64,
        signers_object_id: u64,
        protection_domain_object_id: u64,
        instance_size: u32,
        constant_pool_size: u16,
        const_fields: Vec<(ConstFieldInfo, FieldValue)>,
        static_fields: Vec<(FieldInfo, FieldValue)>,
        instance_fields: Vec<FieldInfo>,
    }
    ...
}
The Vec type contains three words: a length, a capacity, and a pointer. That is 3 * 8 = 24 bytes on a 64-bits architecture.
Boxing each vector would save 16 bytes per field.
pub enum GcRecord {
    ClassDump {
        class_object_id: u64,
        stack_trace_serial_number: u32,
        super_class_object_id: u64,
        class_loader_object_id: u64,
        signers_object_id: u64,
        protection_domain_object_id: u64,
        instance_size: u32,
        constant_pool_size: u16,
        const_fields: Box<Vec<(ConstFieldInfo, FieldValue)>>,
        static_fields: Box<Vec<(FieldInfo, FieldValue)>>,
        instance_fields: Box<Vec<FieldInfo>>,
    }
    ...
}
Fetching the new type's size yields the following:
print-type-size type: `parser::gc_record::GcRecord`: 80 bytes, alignment: 8 bytes
print-type-size     discriminant: 1 bytes
print-type-size     variant `ClassDump`: 79 bytes
print-type-size         padding: 1 bytes
print-type-size         field `.constant_pool_size`: 2 bytes, alignment: 2 bytes
print-type-size         field `.stack_trace_serial_number`: 4 bytes
print-type-size         field `.instance_size`: 4 bytes
print-type-size         padding: 4 bytes
print-type-size         field `.class_object_id`: 8 bytes, alignment: 8 bytes
print-type-size         field `.super_class_object_id`: 8 bytes
print-type-size         field `.class_loader_object_id`: 8 bytes
print-type-size         field `.signers_object_id`: 8 bytes
print-type-size         field `.protection_domain_object_id`: 8 bytes
print-type-size         field `.const_fields`: 8 bytes
print-type-size         field `.static_fields`: 8 bytes
print-type-size         field `.instance_fields`: 8 bytes
This is exactly what we were expecting; one word per boxed field.
But we have learned the hard way not to celebrate prematurely before checking how it pans out in a benchmark.
hyperfine --runs 3 \
 --export-markdown hprof.md \
 -n 0.3.3 "./hprof-slurp-0.3.3 -i pets.bin" \
 -n boxes "./hprof-slurp -i pets.bin"
| Command | Mean [s] | Min [s] | Max [s] | Relative |
|---|---|---|---|---|
0.3.3 | 76.691 ± 3.326 | 73.080 | 79.629 | 1.12 ± 0.05 |
boxes | 68.625 ± 1.262 | 67.202 | 69.605 | 1.00 |
It runs 11% faster. It's not bad for such a small change!
But let's try to go faster by reducing the size of the ClassDump variant even more.
pub struct ClassDumpFields {
    const_fields: Vec<(ConstFieldInfo, FieldValue)>,
    static_fields: Vec<(FieldInfo, FieldValue)>,
    instance_fields: Vec<FieldInfo>,
}

pub enum GcRecord {
    ClassDump {
        class_object_id: u64,
        stack_trace_serial_number: u32,
        super_class_object_id: u64,
        class_loader_object_id: u64,
        signers_object_id: u64,
        protection_domain_object_id: u64,
        instance_size: u32,
        constant_pool_size: u16,
        fields: Box<ClassDumpFields>,
    }
    ...
}
Which has the following type size:
print-type-size type: `parser::gc_record::ClassDumpFields`: 72 bytes, alignment: 8 bytes
print-type-size     field `.const_fields`: 24 bytes
print-type-size     field `.static_fields`: 24 bytes
print-type-size     field `.instance_fields`: 24 bytes
...
print-type-size type: `parser::gc_record::GcRecord`: 64 bytes, alignment: 8 bytes
print-type-size     discriminant: 1 bytes
print-type-size     variant `ClassDump`: 63 bytes
print-type-size         padding: 1 bytes
print-type-size         field `.constant_pool_size`: 2 bytes, alignment: 2 bytes
print-type-size         field `.stack_trace_serial_number`: 4 bytes
print-type-size         field `.instance_size`: 4 bytes
print-type-size         padding: 4 bytes
print-type-size         field `.class_object_id`: 8 bytes, alignment: 8 bytes
print-type-size         field `.super_class_object_id`: 8 bytes
print-type-size         field `.class_loader_object_id`: 8 bytes
print-type-size         field `.signers_object_id`: 8 bytes
print-type-size         field `.protection_domain_object_id`: 8 bytes
print-type-size         field `.fields`: 8 bytes
We shaved off 16 more bytes.
hyperfine --runs 3 \
 --export-markdown hprof.md \
 -n 0.3.3 "./hprof-slurp-0.3.3 -i pets.bin" \
 -n boxes "./hprof-slurp-boxes -i pets.bin" \
 -n box-struct "./hprof-slurp -i pets.bin"
| Command | Mean [s] | Min [s] | Max [s] | Relative |
|---|---|---|---|---|
0.3.3 | 75.638 ± 4.154 | 70.900 | 78.660 | 1.15 ± 0.06 |
boxes | 68.621 ± 0.399 | 68.194 | 68.986 | 1.04 ± 0.01 |
box-struct | 65.978 ± 0.185 | 65.764 | 66.086 | 1.00 |
This last change gave us an extra 4%, which is quite nice.
To go further, one would need to remove unnecessary fields from the ClassDump variant.
Clippy
Before wrapping up this article, it is mandatory to note that Clippy has a lint for this class of problems, which I, of course discovered only much later.
It is called large_enum_variant and kicks in when the difference between the largest variant and the smallest variant is larger than 200 bytes.
The documentation warns us about something very important that we discovered as well.
This lint obviously cannot take the distribution of variants in your running program into account. It is possible that the smaller variants make up less than 1% of all instances, in which case the overhead is negligible and the boxing is counter-productive. Always measure the change this lint suggests.
Let's give this lint a try by creating a clippy.toml file in the project and configuring this lint to be more aggressive with:
enum-variant-size-threshold = 100 # instead of the default value 200
Running cargo clippy yields two entries:
warning: large size difference between variants
  --> src/parser/record.rs:97:5
   |
97 |     GcSegment(GcRecord),
   |     ^^^^^^^^^^^^^^^^^^^ this variant is 128 bytes
   |
note: and the second-largest variant is 58 bytes:
  --> src/parser/record.rs:55:5
   |
55 | /     AllocationSites {
56 | |         flags: u16,
57 | |         cutoff_ratio: u32,
58 | |         total_live_bytes: u32,
...  |
63 | |         allocation_sites: Vec<AllocationSite>,
64 | |     },
   | |_____^
   = help: for further information visit https://rust-lang.github.io/rust-clippy/master/index.html#large_enum_variant
help: consider boxing the large fields to reduce the total size of the enum
   |
97 |     GcSegment(Box<GcRecord>),
   |
We tried this already and it did not work. Clippy tries its best, but remember, it cannot know about the distribution of variants through a static analysis.
And the second entry:
warning: large size difference between variants
   --> src/parser/gc_record.rs:127:5
    |
127 | /     ClassDump {
128 | |         class_object_id: u64,
129 | |         stack_trace_serial_number: u32,
130 | |         super_class_object_id: u64,
...   |
138 | |         instance_fields: Vec<FieldInfo>,
139 | |     },
    | |_____^ this variant is 122 bytes
    |
    = note: `#[warn(clippy::large_enum_variant)]` on by default
note: and the second-largest variant is 49 bytes:
   --> src/parser/gc_record.rs:120:5
    |
120 | /     PrimitiveArrayDump {
121 | |         object_id: u64,
122 | |         stack_trace_serial_number: u32,
123 | |         number_of_elements: u32,
124 | |         element_type: FieldType,
125 | |         array_value: ArrayValue,
126 | |     },
    | |_____^
    = help: for further information visit https://rust-lang.github.io/rust-clippy/master/index.html#large_enum_variant
help: consider boxing the large fields to reduce the total size of the enum
    |
138 |         instance_fields: Box<Vec<FieldInfo>>,
    |                          ~~~~~~~~~~~~~~~~~~~
Which is the lead we ended up exploring as well.
Sometimes the best way to learn is to rediscover what everyone already knows for yourself.
Clippy is truly a fantastic tool and one of my personal favorites in the whole Rust ecosystem. Depending on your context, it may make sense to configure custom values for certain lints to get the most out of them.
Conclusion
This article has presented a bottleneck due to excessive memcopy which was slowing down hprof-slurp prior to the 0.4.0 release.
The final fix took only a few lines of code but had a strong positive effect on performance.
In order to get there, we had to understand a few details regarding the way Rust sizes types internally, more specifically, enumerations.
As a rule of thumb, it is recommended to avoid single outsized variants when creating enumerations as it impacts the memory usage of all variants.
One also must be careful when trying to reduce the stack memory pressure via boxing. Allocating on the heap is not magic, and its cost must be understood in the context of the application.
The next article in this series will go through another interesting optimization encountered while making hprof-slurp faster.
Update: the article submission on reddit/r/rust contains excellent comments.